
From this post we learned that the most common words in Pros are “Smart People,” while those of Cons are “Review System.” Please also recall that the majority was before 2015. So, if Microsoft were to take some actions after the period, it would be possible that the change may not reflect in the charts. Therefore in this post, we will use Time Series chart to see the trend of the mentioned words. But as usual, we need to set things up.
|
1 2 3 4 5 6 7 8 9 10 11 12 13 14 15 16 17 18 |
##### Load Goodies ##### library(tidyverse) library(tidytext) library(stringi) library(stringr) ##### Create Theme for GGPLOT2 ##### theme_moma <- function(base_size = 12, base_family = "Helvetica") { theme( plot.background = element_rect(fill = "#F7F6ED"), legend.key = element_rect(fill = "#F7F6ED"), legend.background = element_rect(fill = "#F7F6ED"), panel.background = element_rect(fill = "#F7F6ED"), panel.border = element_rect(colour = "black", fill = NA, linetype = "dashed"), panel.grid.minor = element_line(colour = "#7F7F7F", linetype = "dotted"), panel.grid.major = element_line(colour = "#7F7F7F", linetype = "dotted") ) } |
The following code is the exact codes used in the post, so we will not cover it again.
|
1 2 3 4 5 6 7 8 9 10 11 12 13 14 15 16 17 18 19 20 21 22 23 24 25 26 27 28 29 30 31 32 33 34 35 36 37 38 39 40 41 42 43 44 45 46 47 48 49 50 51 52 53 54 55 56 57 58 59 60 61 62 63 64 65 66 67 68 69 70 71 72 73 74 75 76 77 78 79 80 81 82 83 84 85 86 87 88 89 90 91 92 93 |
##### Remove First Row ##### data <- data %>% filter(Summary != "xx") ##### Change Date Format ##### temp_1 <- data[1:300,] temp_2 <- data[301:6410,] temp_1$Posted_Date <- as.Date(temp_1$Posted_Date, format = "%d %b, %Y") temp_2$Posted_Date <- as.Date(temp_2$Posted_Date, format = " %b %d, %Y") data2 <- rbind(temp_1,temp_2) rm(temp_1,temp_2) ##### Munging with the Words ##### #Separating Employee Type and Locations data2 <- data2 %>% separate(col = Title, into = c("Employee_Type","Location"),sep = ' in ') %>% separate(col = Employee_Type, into = c("Employee_Type", "Title"), sep = 'ee - ') data2$Employee_Type <- str_replace_all(data2$Employee_Type, "Employ","Employee") ##### Creating New Variables for Munging ##### data2<- data2 %>% mutate(Summary_2 = Summary, Pros_2 = Pros, Cons_2 = Cons) ##### Change to lower case##### data2$Summary_2 <- str_replace_all(data2$Summary_2, "[:alpha:]",tolower) data2$Pros_2 <- str_replace_all(data2$Pros_2, "[:alpha:]",tolower) data2$Cons_2 <- str_replace_all(data2$Cons_2, "[:alpha:]",tolower) ##### Company Name ##### name <- array(c("msft", "microsoft")) for (i in 1:nrow(name)){ print(i) for (j in 8:ncol(data2)) { data2[[j]] <- str_replace_all(data2[[j]],name[[i]],"company") print(j) } } ##### Redacting CEO Name ##### ceo <- array(c("satya", "nadella", "satya nadella")) for (i in 1:nrow(ceo)){ print(i) for (j in 8:ncol(data2)) { data2[[j]] <- str_replace_all(data2[[j]],ceo[[i]],"ceo") print(j) } } ##### Work Life Balance ##### worklife <- array(c("work life balance", "work-life balance", "work/life balance", "work life", "work&life", "worklife")) for (i in 1:nrow(worklife)){ print(i) for (j in 8:ncol(data2)) { data2[[j]] <- str_replace_all(data2[[j]],worklife[[i]],"wlb") } } ##### Remove Punctuations and Numbers ##### data2$Summary_2 <- str_replace_all(data2$Summary_2, "[:punct:]","") data2$Pros_2 <- str_replace_all(data2$Pros_2, "[:punct:]","") data2$Cons_2 <- str_replace_all(data2$Cons_2, "[:punct:]","") data2$Summary_2 <- str_replace_all(data2$Summary_2, "[:digit:]","") data2$Pros_2 <- str_replace_all(data2$Pros_2, "[:digit:]","") data2$Cons_2 <- str_replace_all(data2$Cons_2, "[:digit:]","") ##### Creating Group ##### data2 <- data2 %>% mutate(Group = ifelse(str_detect(Title,"Data Scientist")==TRUE | str_detect(Title,"Data Analyst")==TRUE, "Data Science", ifelse(str_detect(Title,"Engineer")==TRUE, "Engineering", ifelse(str_detect(Title,"SDE")==TRUE, "Engineering", ifelse(str_detect(Title,"Finance")==TRUE,"Finance", ifelse(str_detect(Title,"Financial")==TRUE,"Finance", ifelse(str_detect(Title,"Product")==TRUE,"Product Management", ifelse(str_detect(Title,"Human")==TRUE | str_detect(Title,"Staffing")==TRUE,"Human Resources", ifelse(str_detect(Title,"Marketing")==TRUE,"Marketing", ifelse(str_detect(Title,"Anonymous")==TRUE,"Anonymous", ifelse(str_detect(Title,"Program Manager")==TRUE,"Program Management", ifelse(str_detect(Title,"Director")==TRUE,"Director", ifelse(str_detect(Title,"Intern")==TRUE,"Intern", "Miscellaneous"))))))))))))) |
We are almost ready. First of all, I would like to learn more about Cons. So I’ll make them into a bigram-chart-ready format.
|
1 2 3 4 5 6 7 8 9 10 11 12 13 |
#### Overall - Cons ##### data_cons <- data2 %>% select(Posted_Date, Cons_2) %>% unnest_tokens(words, Cons_2, token = 'ngrams',n = 2) data_cons_split <- data_cons %>% separate(words, c("from","to",sep = " ")) %>% select(1:3) data_cons_clean <- data_cons_split %>% filter(!from %in% stop_words$word) %>% filter(!to %in% stop_words$word) data_cons_chart <- mutate(data_cons_clean, Combine = paste(from,to,sep = " ")) |
Now we are ready to do the Time Series analysis. Let’s review the Cons bigram chart.

We can see that stack ranking or annual review is what employees hated the most. We sure could plot the chart using all of them. But that will be a bit messy. So, I’ll use %in% and put all those variations in the c() .
|
1 2 3 4 5 6 7 8 9 10 11 12 13 14 15 16 17 |
data_cons_chart %>% select(Posted_Date, Combine) %>% arrange(Posted_Date) %>% mutate(Month = format(Posted_Date, "%m")) %>% mutate(Year = format(Posted_Date, "%y")) %>% select(Month, Combine, Year) %>% filter(Combine %in% c("stack rankinging", 'review system', 'review time', 'performance review', 'review model', 'review process', 'annual review', 'rating system', 'ranking system', 'stack rank')) %>% mutate(Count = n()) %>% ggplot(aes(x = Month, group = Count)) + geom_line(stat = "count") + theme_moma() + facet_grid(.~Year) + geom_point(stat = "count") + ggtitle("Stack Ranking") + theme(axis.text.x = element_text(angle = 90, size = 7)) |

It did decrease. I have heard that Mictosoft has banished the stack ranking review, which reflected in fewer complaints from their employees in Glassdoor.
Another comment that I find interesting is “middle management.” Did they do anything to address the concern?
|
1 2 3 4 5 6 7 8 9 10 11 12 13 14 15 16 17 18 |
# Bad Management # data_cons_chart %>% select(Posted_Date, Combine) %>% arrange(Posted_Date) %>% mutate(Month = format(Posted_Date, "%m")) %>% mutate(Year = format(Posted_Date, "%y")) %>% select(Month, Combine, Year) %>% filter(Combine %in% c('Senior leadership','senior management', 'upper management', 'middle management', 'middle managers', 'middel manager', 'bad managers', 'bad manager')) %>% mutate(Count = n()) %>% ggplot(aes(x = Month, group = Count)) + geom_line(stat = "count") + theme_moma() + facet_grid(.~Year) + geom_point(stat = "count") + ggtitle("Management") + theme(axis.text.x = element_text(angle = 90, size = 7)) |

It seems like they didn’t.
What about politics and competition?
|
1 2 3 4 5 6 7 8 9 10 11 12 13 14 15 16 17 |
#Politics and Compeition# data_cons_chart %>% select(Posted_Date, Combine) %>% arrange(Posted_Date) %>% mutate(Month = format(Posted_Date, "%m")) %>% mutate(Year = format(Posted_Date, "%y")) %>% select(Month, Combine, Year) %>% filter(Combine %in% c('highly political', 'internal competition', 'internal politics', 'office politics','competitive environment')) %>% mutate(Count = n()) %>% ggplot(aes(x = Month, group = Count)) + geom_line(stat = "count") + theme_moma() + facet_grid(.~Year) + geom_point(stat = "count") + ggtitle("Politics and Compeition") + theme(axis.text.x = element_text(angle = 90, size = 7)) |
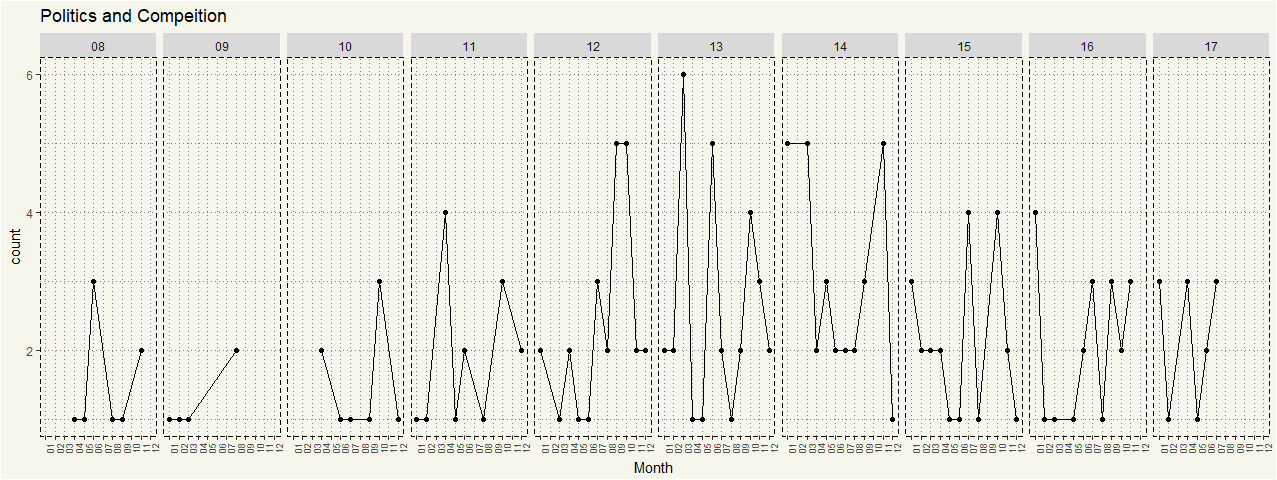
That is about the same.
TL;DR After Microsoft had killed its stack ranking system, the comments in Glassdoor associated with stack ranking decreased.